
Moving to PeruShare
Peru is a solid destination for global professionals, featuring a moderate tax burden of 20.7%. With a very high English proficiency score of 519, daily communication and business integration are seamless. It hosts a vibrant and diverse expat community, notably drawing a significant number of residents from Argentina.
Lifestyle & Vibe
Lima has become a legitimate digital nomad destination with fast urban fiber internet, a rapidly expanding coworking ecosystem in districts like Miraflores and Barranco, and a food scene that consistently ranks among the world's best - a real quality-of-life driver. The cost of living is moderate for Latin America, significantly cheaper than Mexico City or Buenos Aires, and the country offers a straightforward 183-day tourist stay for most nationalities. Crime is a genuine concern - petty theft, express kidnappings, and tourist scams are prevalent in Lima, requiring constant urban awareness and avoiding certain districts entirely. Political instability at the national level is a persistent background risk, but daily life for expats in established neighborhoods is functional and increasingly attractive.
Digital Freedom & Remote Work
Censorship and network interference data is currently being collected for Peru.
Society & Demographics
In Peru, the population is predominantly female, with a slight majority of 50.27% compared to males at 49.73%. With an impressive internet penetration rate of 81.96%, digital connectivity has significantly impacted daily life and access to information. Despite this technological advancement, socioeconomic inequality persists, as indicated by the GINI index of 40.10, reflecting moderate income disparity. The country's urbanization rate stands at 85.19%, while women hold a notable position in parliament with 38.46% representation, showcasing advancements in gender equality.
Gender Distribution
Aging Society
Population over 65 years old
Education Spending
UNESCO Data. Indicates focus on public schooling.
Quality of Life
In Peru, the average life expectancy stands at 71.67 years, reflecting a generally healthy populace. With 16.88 medical doctors per 10,000 people and an Universal Health Coverage Index of 68, healthcare access is reasonably good but with room for improvement in some areas. The country faces challenges such as a happiness score of 5.97 (on a scale of 0 to 10) and an obesity rate of 29.15%, while the air quality index at 27.04 µg/m³ and an average working week of 39.6 hours also impact overall well-being. Despite these factors, Peru's homicide rate of 8.6 per 100k people suggests a relatively safe environment for its residents.
Economic Freedom & Business Climate
The Peruvian economy currently exhibits a relatively stable business climate with an inflation rate of 2.01%, keeping prices under control. While the GDP per capita is not available for reference, Peru's overall Economic Freedom Score stands at 66.30, highlighting moderate economic freedom. Key areas like Business Freedom (73.10) and Trade Freedom (81.60) are strong contributors to this score. However, challenges remain, as evidenced by lower ratings in Property Rights (44.00), Government Integrity (35.00), and Tax Burden (79.40), which collectively impact the financial freedom of 60.00.
Evaluated across 12 quantitative factors. Scores span 0-100, where higher scores indicate greater economic liberty, lighter tax burdens, and stronger property rights.
Climate Profile (Lima)
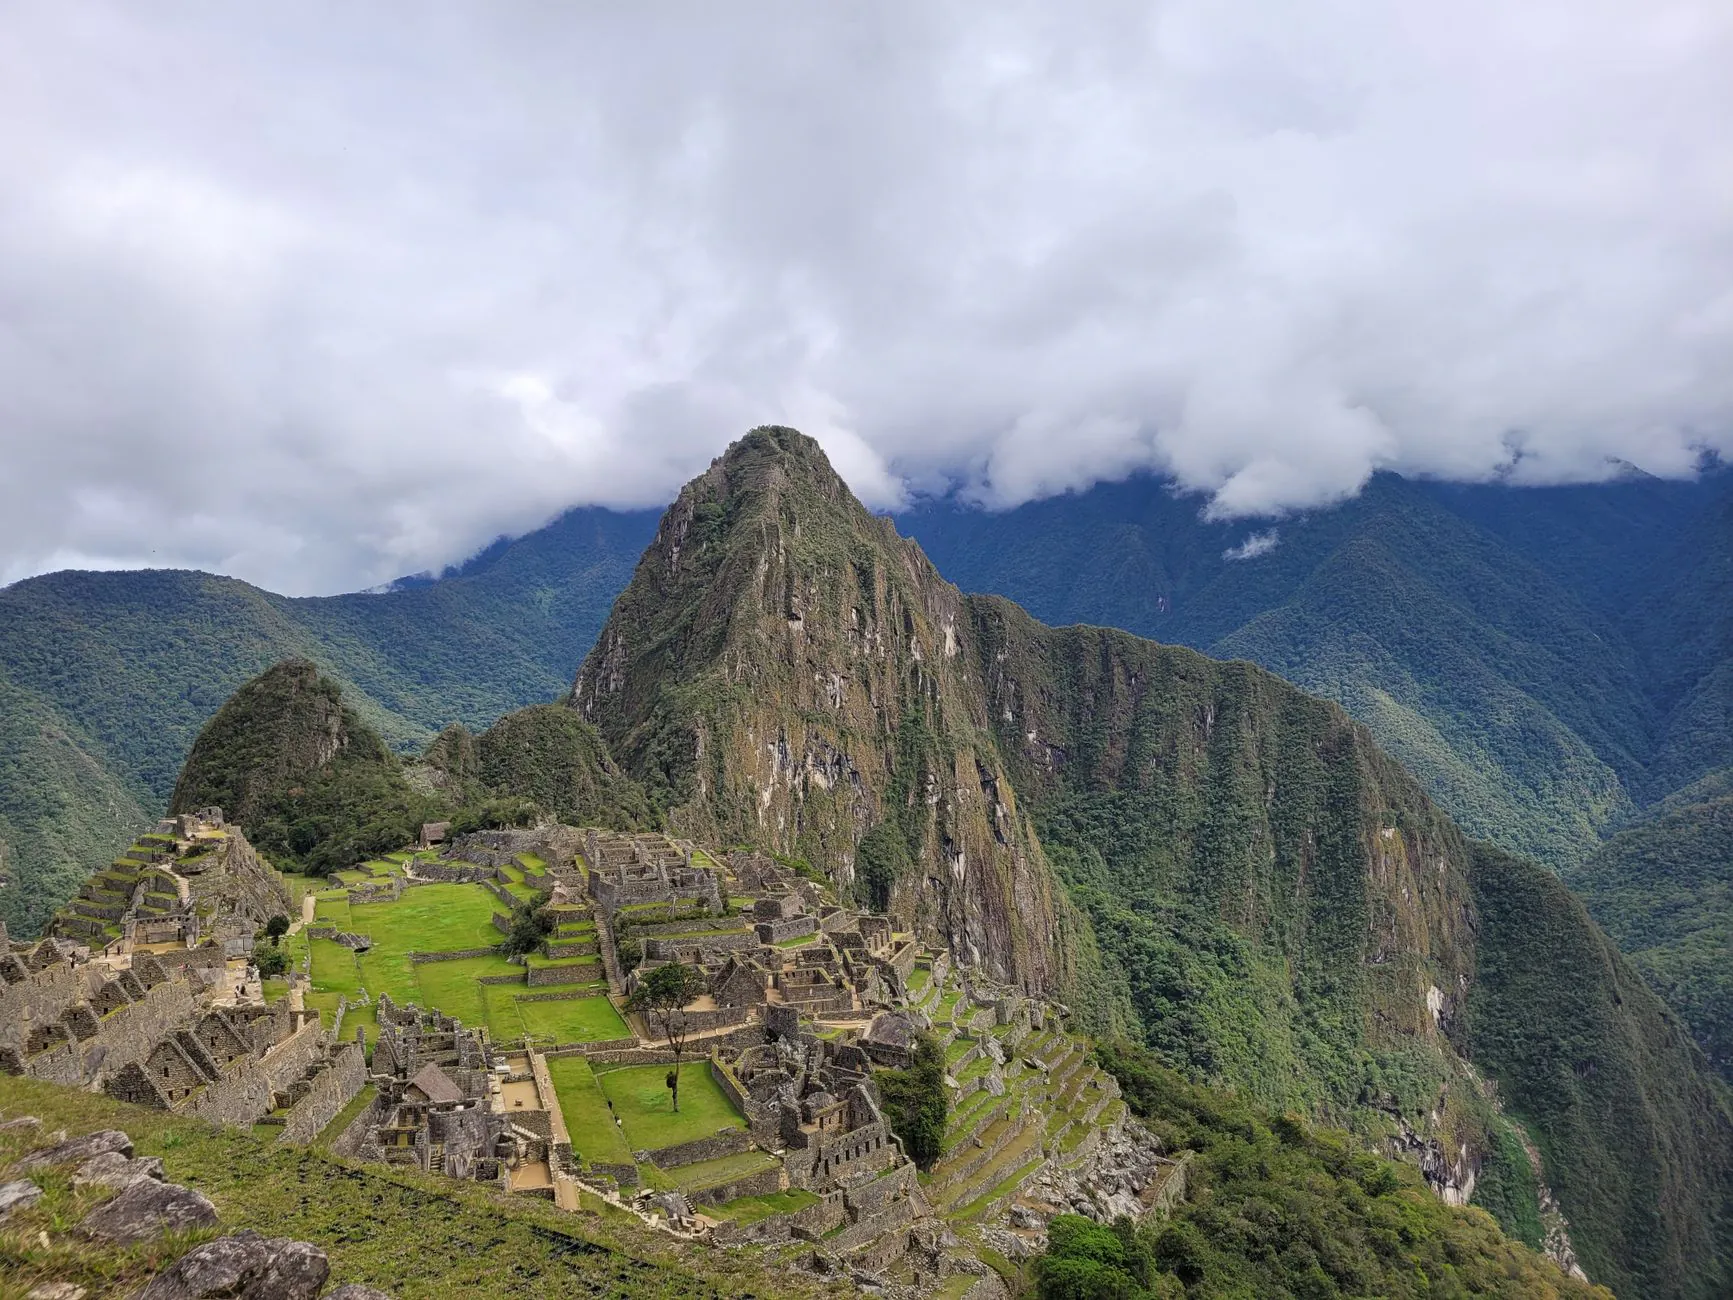
Peru's climate is characterized as a tropical savanna, with warm temperatures and distinct wet and dry seasons, making it an attractive destination for expats and digital nomads seeking a unique blend of culture and adventure. The hottest period of the year occurs from January to March, with average maximum temperatures ranging from 24 to 25 degrees Celsius, while the rainiest months are January and December, with 12 and 8 rainy days respectively, making the dry season from May to September the best time to relocate or visit for comfortable weather. With its mild winters and pleasant spring-like temperatures during the dry season, Peru is an ideal location for those seeking a warm and welcoming climate, with the months of May to September offering the perfect blend of sunshine and gentle breezes, making it an excellent time to explore the country's vibrant cities, ancient ruins, and stunning natural landscapes.
Political Stability & Governance
Evaluated across Worldwide Governance Indicators (WGI). Scores span approximately -2.5 to 2.5, where higher scores indicate stronger governance, better stability, and lower corruption.
Relocation Guides & Articles

July 17, 2026
Moving to Peru in 2026: $1,000 Passive Income Visa & Lima Living Under $500
Peru's rentista visa requires just $1,000/month in passive income, and Lima apartments rent for under $500. Explore residency rules, food culture, and taxes.
June 25, 2026
Peru Digital Nomad Visa 2026: The Ghost Visa Traps, 90-Day Rule & What Nobody Tells You (Real Costs & Workarounds)
A comprehensive guide to Peru's Digital Nomad Visa situation in 2026, including the 90-day tourist trap, Independent Worker alternatives, and real costs.
Explore Similar Destinations
Frequently Asked Questions
What is the tax burden in Peru?
The tax burden in Peru is approximately 20.7%, according to World Bank data.
Is Peru safe?
The homicide rate in Peru is 8.6 per 100,000 people (World Bank).
Are people happy in Peru?
The World Happiness Report scores Peru at 6.0 out of 10.