Moving to CroatiaShare
While living in Croatia comes with a higher tax burden of 35.1%, expats often benefit from its robust social infrastructure and high quality of life. With a very high English proficiency score of 617, daily communication and business integration are seamless. It hosts a vibrant and diverse expat community, notably drawing a significant number of residents from Bosnia and Herzegovina.
Lifestyle & Vibe
Croatia offers a formal Digital Nomad Residence Permit and has become a credible remote work base in the EU zone, with Split and Dubrovnik attracting tech professionals seeking Mediterranean climate without the chaos of Southern European bureaucracy. The cost of living is lower than Western Europe but rising fast - Split is no longer cheap, and the tourist-season rental market makes year-round housing a real logistical challenge. Internet infrastructure in urban areas is reliable and fast, the expat social scene peaks in summer before thinning out dramatically in winter, and cashless payments are now standard across most of the country post-euro adoption. If you want EU timezone alignment, Adriatic lifestyle, and relative safety, Croatia is a serious option - just plan your housing well in advance.
Digital Freedom & Remote Work
Censorship and network interference data is currently being collected for Croatia.
Society & Demographics
Croatia presents a balanced gender distribution with slightly more females (51.76%) than males (48.24%), indicating a relatively stable social structure. Its high internet penetration rate of 83.63% suggests widespread digital literacy and connectivity, while the EF English Proficiency Score of 617 reflects an intermediate level of English proficiency among its populace. With a GINI index of 30.10, Croatia demonstrates moderate income inequality, supported by educational spending that accounts for 8.5% of GDP - facilitating equitable access to resources and opportunities.
Gender Distribution
Aging Society
Population over 65 years old
Education Spending
UNESCO Data. Indicates focus on public schooling.
Quality of Life
Croatia has a life expectancy of 76.86 years, reflecting its robust healthcare system, which is supported by an impressive ratio of 39.73 medical doctors per 10k people. The country’s Universal Health Coverage Index stands at 76.00, indicating comprehensive access to health services. Despite a happiness score of 6.009 on a scale of 0-10, Croatia offers a balanced lifestyle with an average workweek of 37.4 hours and air quality measured at 16.12 µg/m³, significantly lower than the EU average, contributing to overall well-being.
Economic Freedom & Business Climate
The Croatian economy exhibits a moderately free market structure with an inflation rate of 2.97%, an unemployment rate of 5.0%, and an Economic Freedom Score of 67.5 out of 100. Property rights are well-protected, rated at 81.1, while judicial effectiveness stands at 71.7, ensuring a stable business climate. However, challenges persist in areas such as government integrity (52.6) and investment freedom (60), which could benefit from further improvement to enhance overall financial freedom, currently at 60.
Evaluated across 12 quantitative factors. Scores span 0-100, where higher scores indicate greater economic liberty, lighter tax burdens, and stronger property rights.
Climate Profile (Zagreb)
Croatia has a captivating Mediterranean climate, characterized by warm summers and mild winters, with the hottest period typically occurring in July and August, when average maximum temperatures soar to 28 degrees Celsius, while the rainiest months are May and June, with 21 and 17 rainy days respectively. The spring and autumn seasons, from April to June and September to November, are the most pleasant times to visit or relocate, with gentle temperatures ranging from 17 to 22 degrees Celsius, making them ideal for outdoor exploration and settling into the local way of life. For expats and digital nomads seeking comfortable weather, the best season to relocate or visit Croatia is undoubtedly from September to October, when the summer crowds have dissipated, and the warm, sunny days are accompanied by a gentle breeze, creating a perfect balance of warmth and tranquility.
Political Stability & Governance
Evaluated across Worldwide Governance Indicators (WGI). Scores span approximately -2.5 to 2.5, where higher scores indicate stronger governance, better stability, and lower corruption.
Relocation Guides & Articles
July 12, 2026
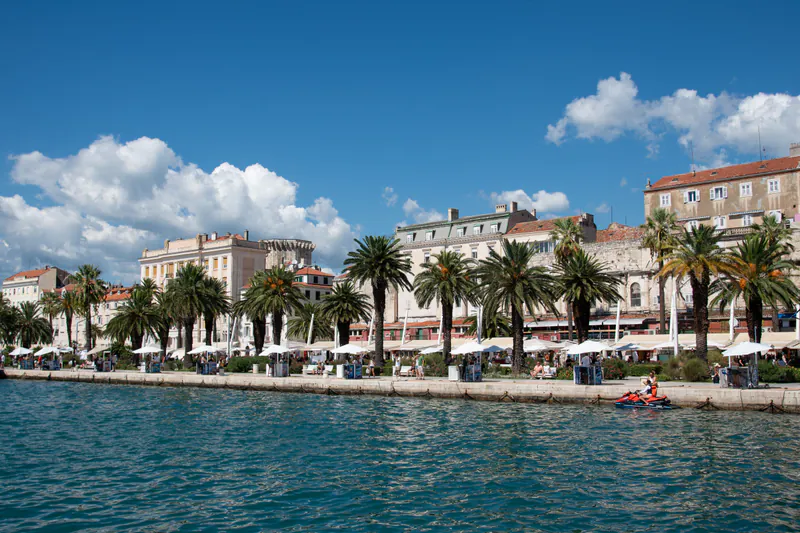
Croatia Digital Nomad Visa 2026: The Brutal Truth About the 0% Tax Eurozone Loophole
A comprehensive 2026 guide to Croatia's Digital Nomad Visa. Discover the €3,622 income requirement, the 0% tax exemption, and the strict 18-month stay limit.
July 10, 2026
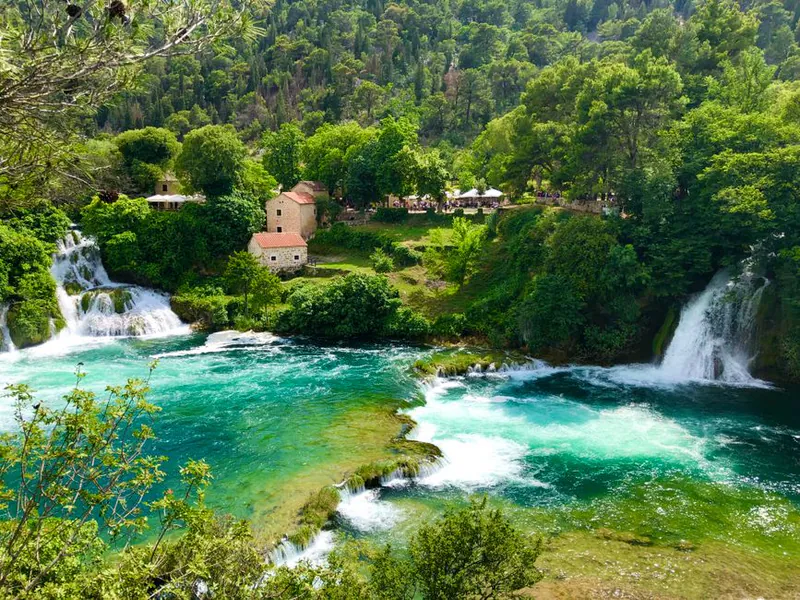
Moving to Croatia in 2026: Digital Nomad Visa, Eurozone Reality & Coastal Rent
Relocating to Croatia in 2026: how the digital nomad permit works, Eurozone price changes, Split and Zagreb rent benchmarks, and healthcare access.
Frequently Asked Questions
What is the tax burden in Croatia?
The tax burden in Croatia is approximately 35.1%, according to World Bank data.
Is Croatia safe?
The homicide rate in Croatia is 0.7 per 100,000 people (World Bank).
Are people happy in Croatia?
The World Happiness Report scores Croatia at 6.0 out of 10.
Head-to-Head Relocation Comparisons
Compare taxes, safety, and living costs of Croatia against top alternatives.